HTML Report
Concept
Proper cleaning is the first step to perform proper analyses on high-throughput sequencing data.
To assess the quality of raw reads and how it is improved by the cleaning, the clean module internally runs the famous quality check program, FastQC, or its faster emulator, Falco, on the reads before and after cleaning.
Although both programs generate informative reports, they are in separate files for each sample, each read direction (for paired-end), and before and after cleaning.
This makes it tedious to review every report, and can lead to overlook some serious problems, such as residual low-quality bases or adaptor sequences, contamination of different samples, and improper setting of cleaning parameters.
Captus summarizes the information in those disparate reports into a single HTML file. All you need to do is open captus-clean_report.html with your browser (internet connection required) to get a quick overview on all your samples, both reads (for paired-end), and before and after cleaning!
-
The entire report is based on tables stored in the
03_qc_extrasdirectory. -
All tables and plots in the report are interactive powered by
Plotly.
Visit the following sites once to take full advantage of its interactivity:
Contents
The report comprises the following nine sections:
A brief description and interactive example of each section is given below.
By switching the tabs at the top of each plot, you can compare the plot produced by Captus with the corresponding plot from FastQC.
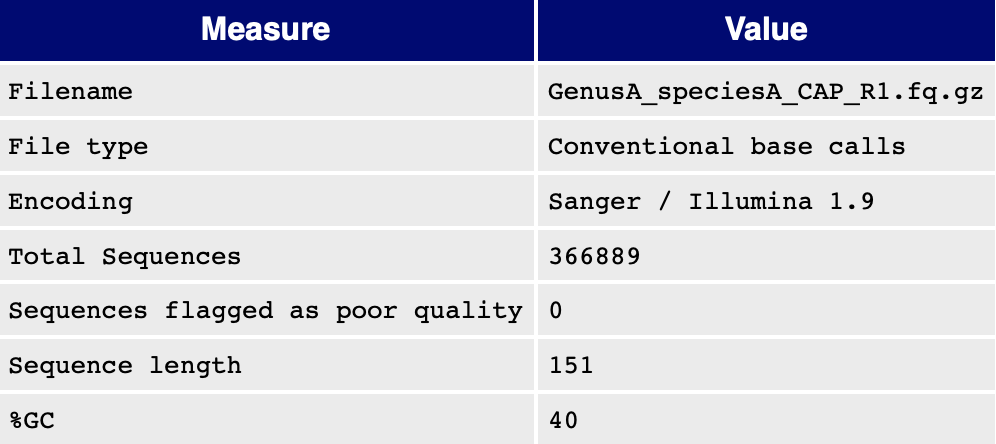
1. Summary Table
This table shows general cleaning statistics for each sample.
Features:
- Switch the
Sort bydropdown to re-sort the table by any column value. - Cells are color-coded according to value (high = green; low = pink).
2. Stats on Reads/Bases
Captus cleans reads through two consecutive rounds of adaptor trimming (Round1, Round2) followed by quality trimming and filtering.
This plot shows changes in the number of reads (left panel) and bases (right panel) at each step of the cleaning process.
Features:
- Switch the buttons at the top to choose whether to show counts or percentages.
- Samples are sorted by the number or percentage of bases passed cleaning.
- Click on the legend to toggle hide/show of each data series.
There is no corresponding plot.
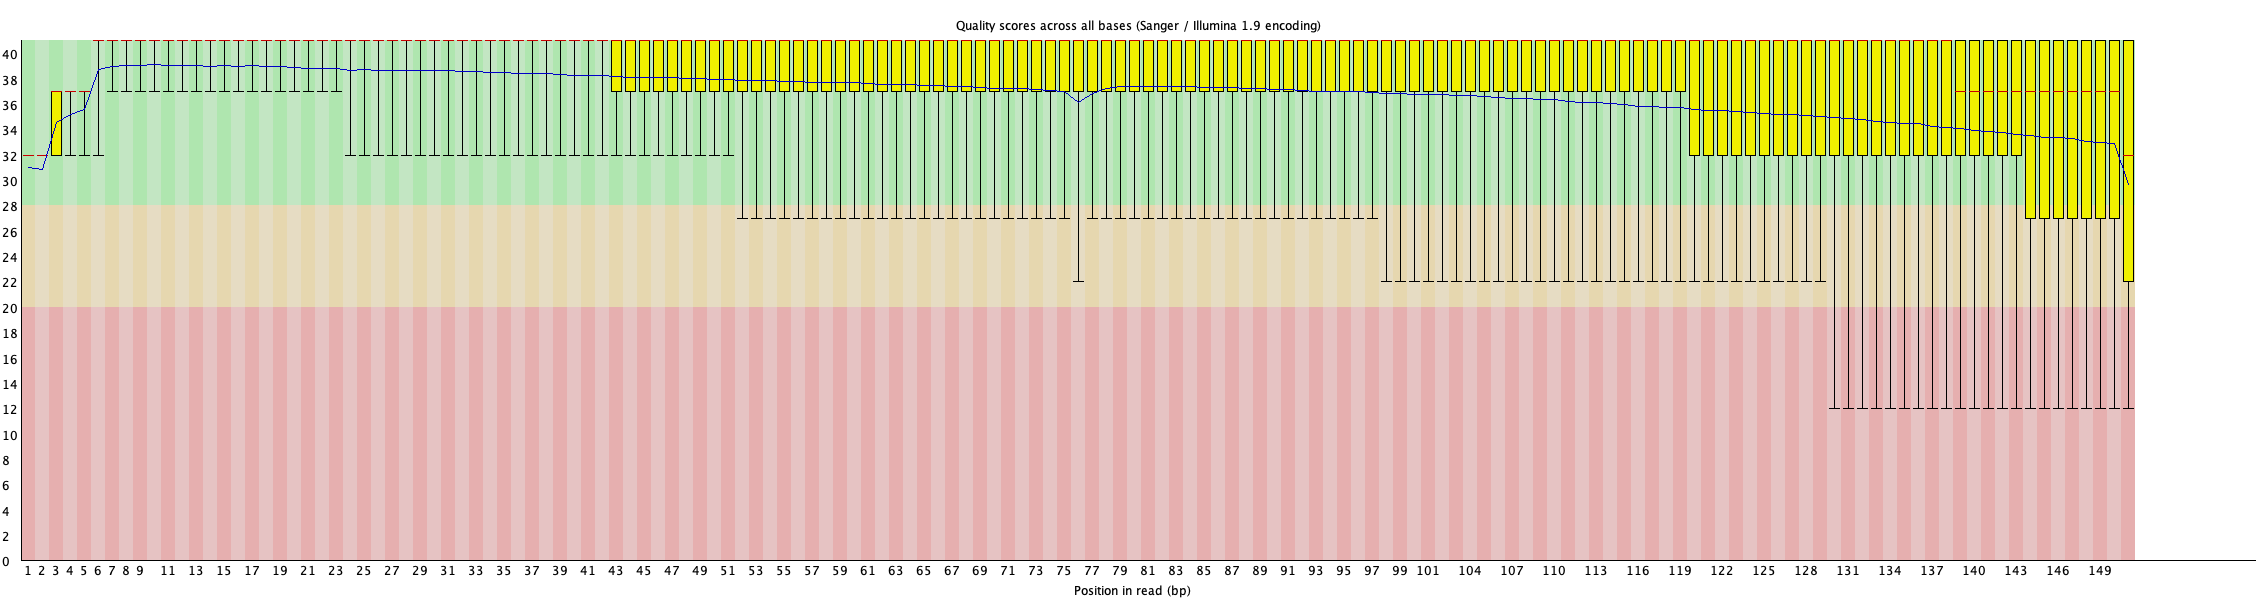
3. Per Base Quality
This plot shows the range of Phred quality score at each position in the reads before and after cleaning.
For more details, read FastQC documentation.
Feature:
- Switch the dropdown at the top to change the variable to show, these variables represent the elements of the boxplots in the
FastQCreport.
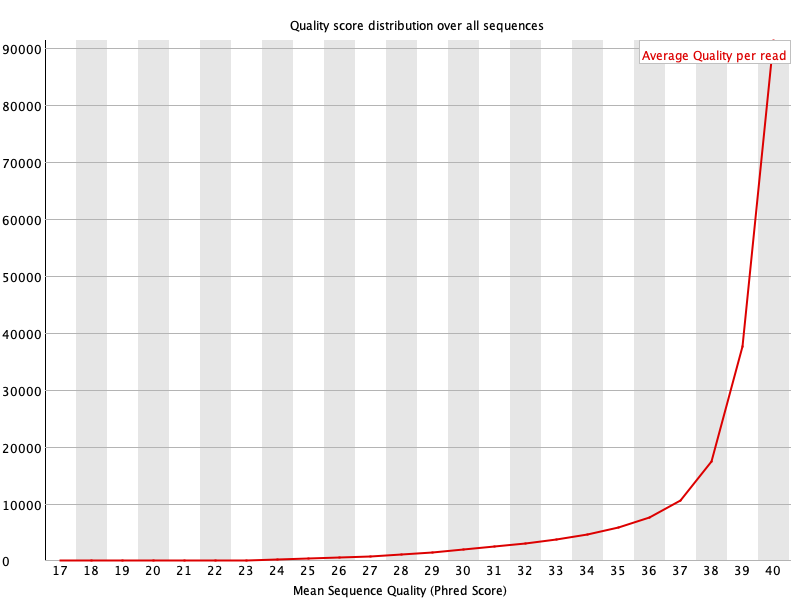
4. Per Read Quality
This plot shows the distribution of mean Phred quality score for each read before and after cleaning.
For more details, read FastQC documentation.
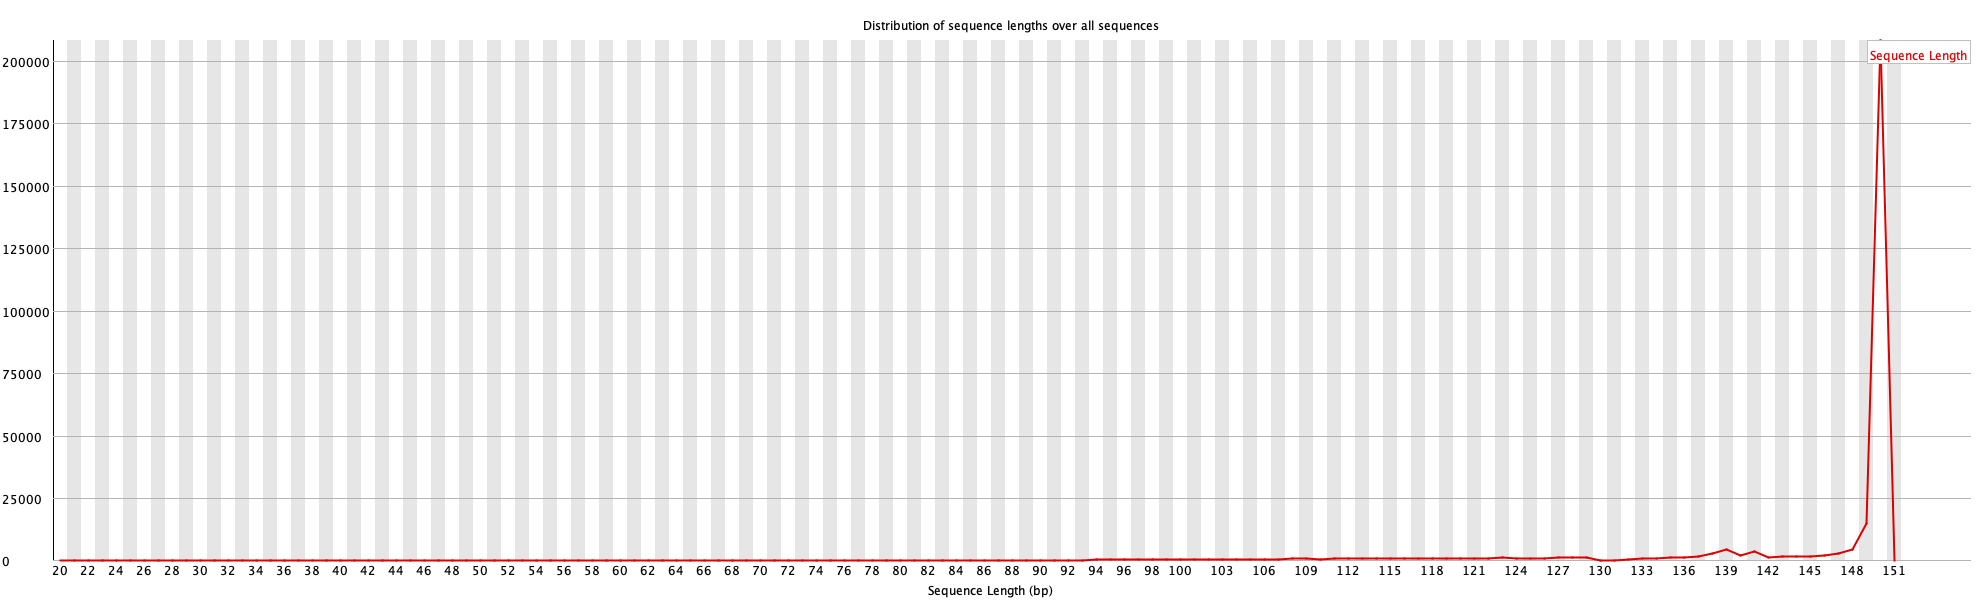
5. Read Length Distribution
This plot shows the distribution of read lengths before and after cleaning.
For more details, read FastQC documentation.
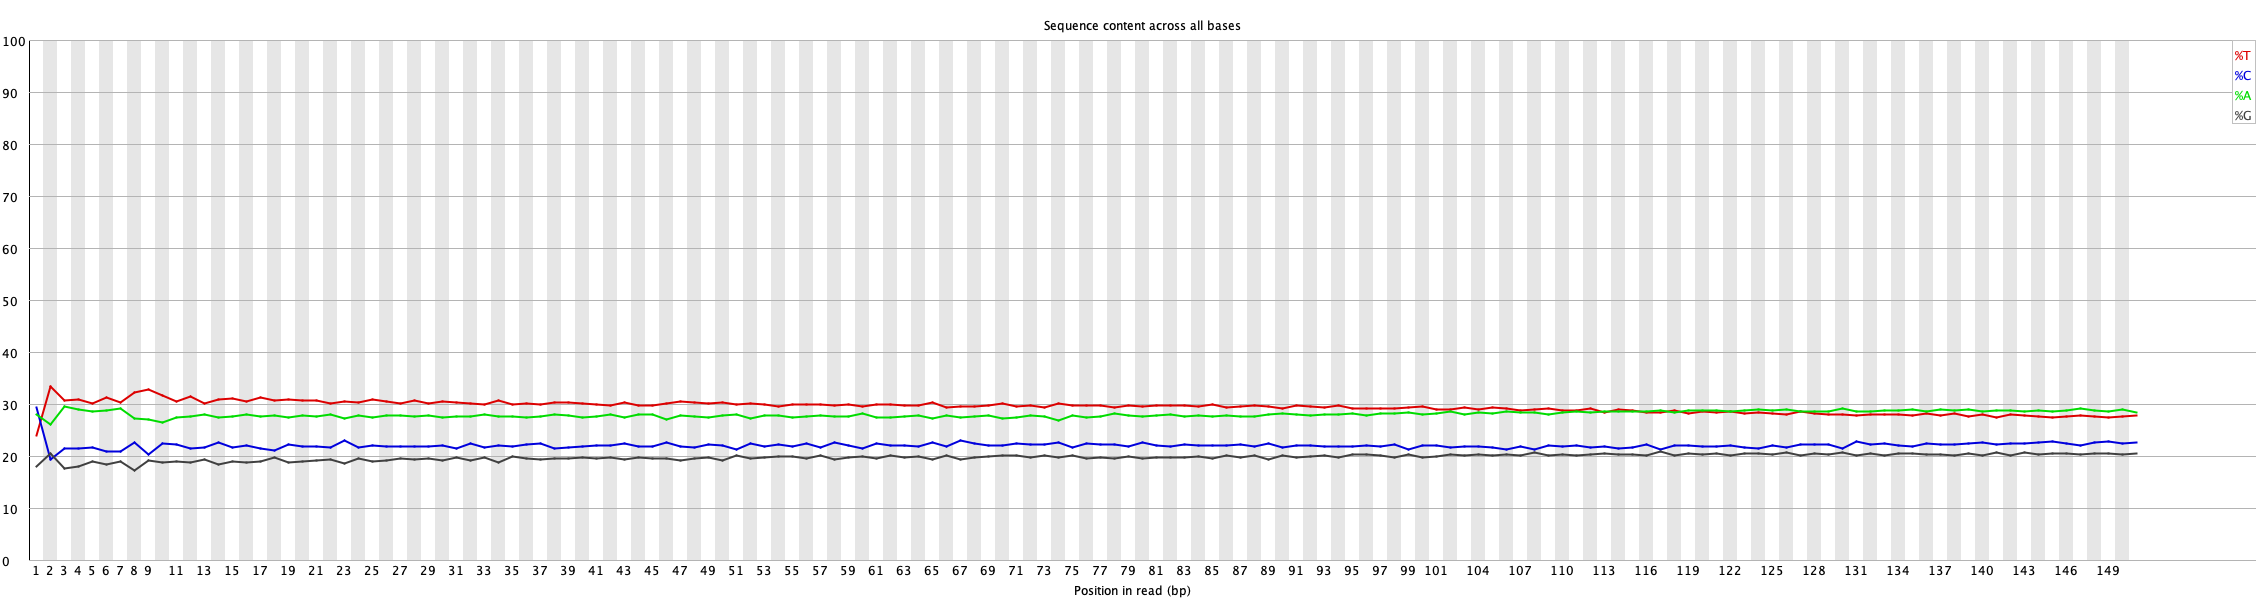
6. Per Base Nucleotide Content
This plot shows the composition of each nucleotide (A, T, G, C) at each position in the reads before and after cleaning.
If a particular nucleotide is overrepresented at a certain position in the reads, you will see the color corresponding to that nucleotide; otherwise, the plot will be a uniform grayish color.
For more details, read FastQC documentation.
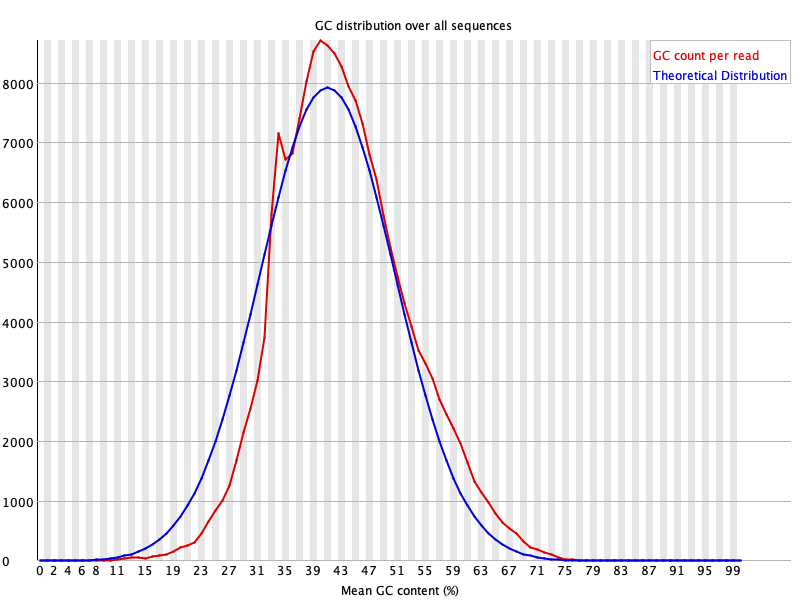
7. Per Read GC Content
This plot shows the frequency of GC content in the reads before and after cleaning.
Broader or bimodal peaks may indicate contamination with DNA from different organisms.
For more details, read FastQC documentation.
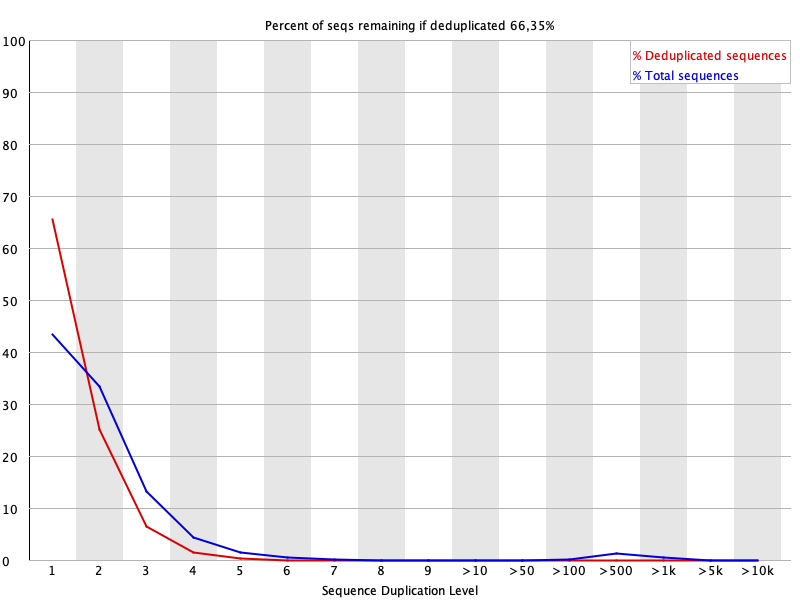
8. Sequence Duplication Level
This plot shows the percentage of sequences with different degrees of duplication before and after cleaning.
For more details, read FastQC documentation.
Feature:
- Click on the legend to toggle hide/show of each data series.
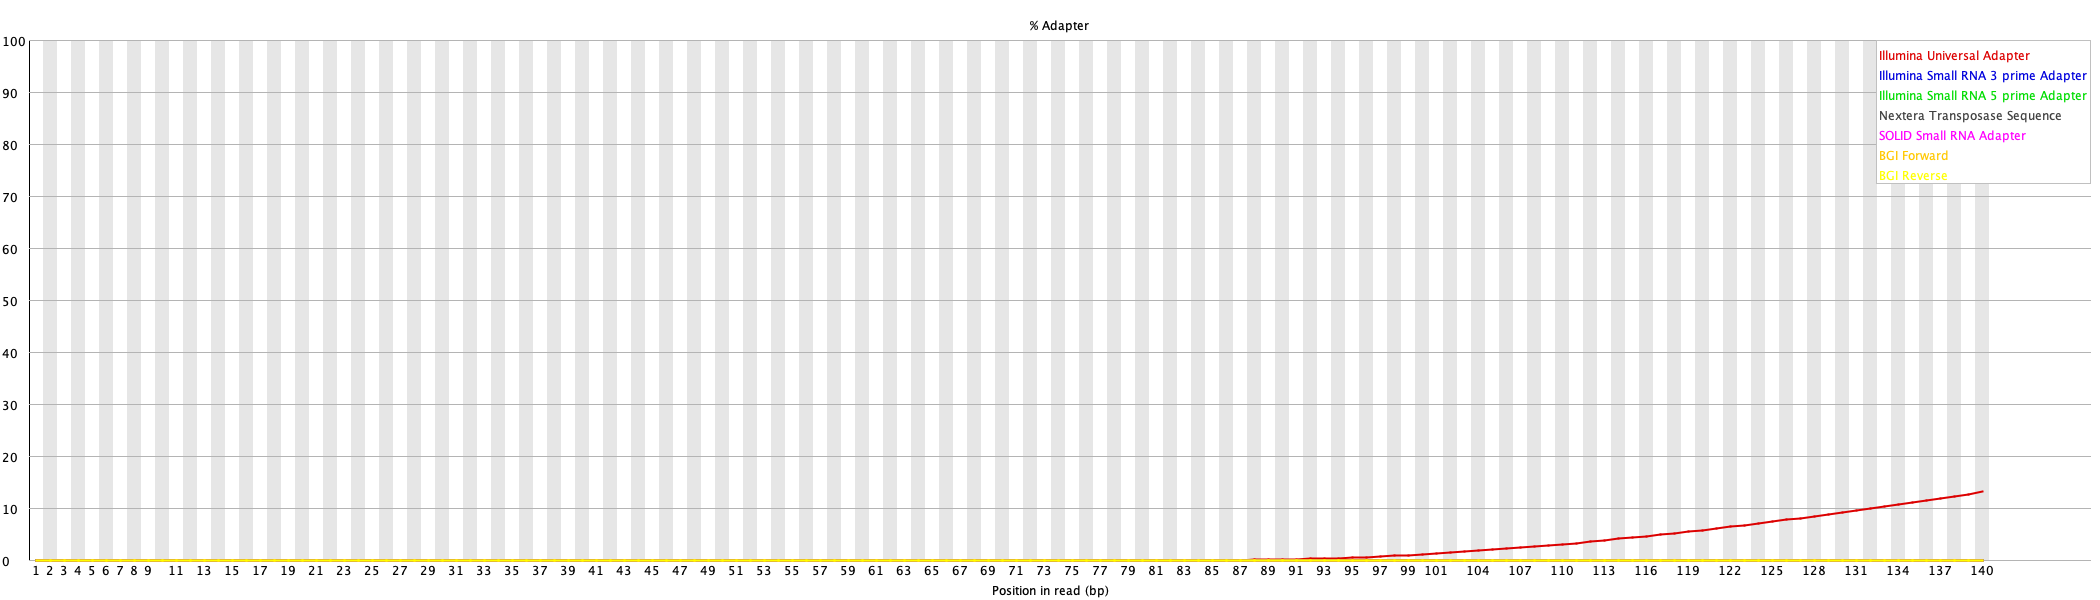
9. Adaptor Content
This plot shows the cumulative adaptor content at each position in the reads before and after cleaning.
For more details, read FastQC documentation.
Created by Gentaro Shigita (11.08.2021)
Last modified by Gentaro Shigita (23.12.2024)